Market Outlook
August 22, 2016
Market Cues
Domestic Indices
Chg (%)
(Pts)
(Close)
Indian markets are likely to open in positive note tracking SGX Nifty.
BSE Sensex
(0.2)
(46)
28,077
Nifty
(0.1)
(6)
8,667
US stocks took small losses on Friday as interest rate hike fears dampened a strong
performance for the week. Investors are currently waiting for the Fed Chairwoman’s
Mid Cap
0.5
67
13,035
comments on August 26 to watch for clues about interest rate actions. Telecom
Small Cap
0.4
56
12,459
companies reported their worst decline since 2014 with energy and utility stocks
Bankex
0.5
101
22,296
losing ground as well.
The European markets ended Friday's session with losses, due to a sharp decline in
Global Indices
Chg (%)
(Pts)
(Close)
mining and banking stocks. The markets fell during the afternoon session on back of
Dow Jones
(0.2)
(45)
18,553
poor economic data from the US. Weak crude oil prices also put pressure on prices
Nasdaq
(0.0)
(2)
5,238
of producers. Auto stocks also gave a poor performance after BMW’s outlook was
FTSE
(0.1)
(10)
6,859
downgraded.
Nikkei
0.4
60
16,546
Indian markets ended with small losses on Friday due to subdued global sentiment
Hang Seng
(0.4)
(86)
22,937
and weak Asian markets. Market breadth was good with most stocks ending
Shanghai Com
0.1
4
3,108
positive. Metals and consumer goods had the best sectoral performance whereas
Auto dragged down the index.
Advances / Declines
BSE
NSE
News Analysis & Result Review
Advances
1,485
898
News: Fortis Healthcare approves demerger of diagnostics business
Declines
1,242
698
News: Apollo Tyres to invest in `1,700 cr in capacity expansion
Unchanged
181
81
Detailed analysis on Pg2
Investor’s Ready Reckoner
Volumes (` Cr)
Key Domestic & Global Indicators
BSE
3,506
Stock Watch: Latest investment recommendations on 150+ stocks
NSE
20,309
Refer Pg6 onwards
Top Picks
Net Inflows (` Cr)
Net
Mtd
Ytd
CMP
Target
Upside
Company
Sector
Rating
FII
255
7,514
38,397
(`)
(`)
(%)
MFs
6
(189)
8,599
Amara Raja
Auto/Auto Ancillary
Buy
920
1,076
16.9
HCL Tech
IT
Buy
780
1,000
28.1
Top Gainers
Price (`)
Chg (%)
HDFC Bank
Financials
Accumulate
1,245
1,350
8.4
Bharat Electronics
Capital Goods
Buy
1,230
1,414
15.0
Hindcopper
70
7.9
Navkar Corporation Others
Buy
195
265
35.7
Ktkbank
153
7.7
More Top Picks on Pg4
Petronet
344
5.2
Indiacem
132
5.2
Key Upcoming Events
Previous
Consensus
Tatachem
544
5.2
Date
Region
Event Description
Reading
Expectations
Aug 23
US
New Home sales
592.0
579.0
Top Losers
Price (`)
Chg (%)
Aug 23 Germany
PMI Services
54.4
--
Sci
71
(4.9)
Aug 24 Germany
PMI Manufacturing
53.8
--
Star
987
(3.3)
Aug 26
US
GDP QoQ (Annualised)
1.2
1.1
Fortis
188
(3.3)
Aug 26
UK GDP YoY
2.2
--
6.(
More Events on Pg5
Muthootfin
350
(3.1)
Escorts
305
(2.8)
As on August 19, 2016
Market Outlook
August 22, 2016
News Analysis
Fortis Healthcare approves demerger of diagnostics business
Fortis Healthcare announced on Friday that its board had approved the demerger
of its diagnostics business. This move is aimed at ensuring independent growth of
the hospital as well as diagnostics businesses. The company's board approved a
proposal to demerge its diagnostics business, including its subsidiary SRL Ltd into
another majority-owned subsidiary, Fortis Malar Hospitals pursuant to a composite
scheme of arrangement and amalgamation, Fortis Healthcare said in a regulatory
filing.
As part of the process, Fortis Malar will sell its hospital business to Fortis
Healthcare for a lump sum cash consideration of `43 crore and the name of Fortis
Malar will subsequently be changed to SRL. This company is then proposed to be
listed on the National Stock Exchange in addition to its current listing on the BSE.
The management aims to unlock immense value for shareholders as well improve
both the hospital and diagnostic businesses due to the greater clarity and stronger
focus.
Fortis Healthcare shares on Friday ended at `187.80 apiece on the BSE, down
3.27% from previous close.
Apollo Tyres to invest in `1,700 cr in capacity expansion
Apollo Tyres announced plans to invest `1,600-1,700 cr, a bulk of it in its
Chennai facility, and 200 million euros in a greenfield facility in Hungary in 2016-
17. The planned expansion would give the Hungarian facility a capacity of 5.5
million car and light truck tyres and 675,000 heavy truck tyres. Commercial
production at the Hungarian plant is expected to begin in the first quarter of 2017.
The Chennai plant’s capacity will be increase to 12,000 truck-bus radials and
16,000 car tyres a day in a couple of years. This capacity is expected to come
onstream from the last quarter of 2016.
The investment will be funded by internal accruals and borrowing. Apollo Tyres’
gross debt went up from `690 cr to `970 cr due to loans taken for the expansion
of the Chennai plant.
Economic and Political News
Capacity expansion for the port of Vishakhapatnam at a cost of `450 cr
Ministry of Water Resources announces projects worth `560 cr under Namami
Gange programme
Domestic Air traffic grows by 25% YoY from 6.7 mln to 8.5 mln for the month
of July
Corporate News
Sun TV announces that it expects approval from the centre for its FM radio
business
State Bank of India announces merger of its associate banks
Ujjivan Finance applies to RBI for small finance bank license
Market Outlook
August 22, 2016
Quarterly Bloomberg Brokers Consensus Estimate
NTPC Ltd - Aug 22, 2016
Particulars (` cr)
1QFY17E
1QFY16
y-o-y (%)
4QFY16
q-o-q (%)
Net sales
18,520
17,019
8.8
17,990
2.9
EBITDA
5,098
3,438
48.3
5,458
(6.6)
EBITDA margin (%)
27.5
20.2
30.3
Net profit
2,396
2,135
12.2
2,716
(11.8)
Hindustan Petroleum Corp Ltd - Aug 22, 2016
Particulars (` cr)
1QFY17E
1QFY16
y-o-y (%)
4QFY16
q-o-q (%)
Net sales
37,163
51,720
(28.1)
42,126
(11.8)
EBITDA
2,433
3,063
(20.6)
2,661
(8.6)
EBITDA margin (%)
6.5
5.9
6.3
Net profit
1,221
1,588
(23.1)
1,553
(21.4)
Tata Power Ltd Consol - Aug 23, 2016
Particulars (` cr)
1QFY17E
1QFY16
y-o-y (%)
4QFY16
q-o-q (%)
Net sales
9,275
9,235
0.4
9,375
(1.1)
EBITDA
1,995
2,181
(8.5)
1,913
4.3
EBITDA margin (%)
21.5
23.6
20.4
Net profit
341
241
41.3
360
(5.3)
Market Outlook
August 22, 2016
Top Picks
Large Cap
Market Cap
CMP
Target
Upside
Company
Rationale
(` Cr)
(`)
(`)
(%)
To outpace battery industry growth due to better technological
Amara Raja Batteries
15,718
920
1,076
16.9
products leading to market share gains in both the automotive
OEM and replacement segments.
Uptick in defense capex by government, coupled with BELs
Bharat Electronics
29,510
1,230
1,414
15.0
strong market positioning, indicate good times ahead for BEL.
HCL Tech
1,10,095
780
1,000
28.1
Stock is trading at attractive valuations & factors all bad news.
Strong visibility for a robust 20% earnings trajectory, coupled
HDFC Bank
3,15,189
1,245
1,350
8.4
with high quality of earnings on account of high quality retail
business and strategic focus on highly rated corporates.
Back on the growth trend, expect a long term growth of 14% to
Infosys
2,34,541
1,021
1,370
34.2
be a US$20bn in FY2020.
Strong market positioning within the domestic AC markets to
Voltas
12,628
382
407
6.6
continue, EMP business set to revive
Source: Company, Angel Research
Mid Cap
Market Cap
CMP
Target
Upside
Company
Rationale
(` Cr)
(`)
(`)
(%)
Among the top 4 players in the consumer durables segment.
Bajaj Electricals
2,626
260
277
6.6
Improved profitability backed by turn around in E&P segment.
Strong order book lends earnings visibility.
Favourable outlook for the AC industry to augur well for
Cooling products business which is out pacing the market
Blue Star
4,726
496
527
6.3
growth. EMPPAC division's profitability to improve once
operating environment turns around.
Strong loan growth backed by diversified loan portfolio and
Equitas Holdings
6,230
186
235
26.5
adequate CAR. ROE & ROA likely to remain decent as risk of
dilution remains low. Attractive valuations considering growth.
Expectations of above average monsoon augurs well for
Goodyear India
1,278
554
631
13.9
Goodyear India as it derives ~50% of its turnover from farm
tyre segment.
Commencement of new projects, downtrend in the interest rate
IL&FS Transport
2,240
68
93
36.6
cycle, to lead to stock re-rating
Economic recovery to have favourable impact on advertising &
Jagran Prakashan
6,018
184
205
11.4
circulation revenue growth. Further, the acquisition of a radio business
(Radio City) would also boost the company`s revenue growth.
Speedier execution and speedier sales, strong revenue visibility
Mahindra Lifespace
1,789
436
554
27.0
in short-to-long run, attractive valuations
Massive capacity expansion along with rail advantage at ICD as
Navkar Corporation
2,786
195
265
35.7
well CFS augurs well for the company
Earnings boost on back of stable material prices and favourable
Radico Khaitan
1,340
101
125
24.1
pricing environment. Valuation discount to peers provides
additional comfort
Strong brands and distribution network would boost growth
Siyaram Silk Mills
1,059
1,130
1,347
19.3
going ahead. Stock currently trades at an inexpensive valuation.
Market leadership in Hindi news genre and no. 2 viewership
TV Today Network
1,788
300
363
21.1
ranking in English news genre, exit from the radio business, and
anticipated growth in ad spends by corporates to benefit the stock.
Source: Company, Angel Research
Market Outlook
August 22, 2016
Key Upcoming Events
Result Calendar
Date
Company
August 22, 2016
NTPC
August 23, 2016
Tata Power Co.
August 26, 2016
Tata Motors
Source: Bloomberg, Angel Research
Global economic events release calendar
Bloomberg Data
Date
Time
Country Event Description
Unit
Period
Last Reported Estimated
Aug 23, 2016
2:30 PM Euro Zone
Euro-Zone CPI (YoY)
% Jul F
0.20
0.20
7:30 PM
US
New home sales
Thousands
Jul
592.00
577.00
11:30 AM Germany
GDP nsa (YoY)
% Change 2Q F
3.10
1:00 PM Germany
PMI Services
Value Aug P
54.40
Aug 24, 2016
1:00 PM Germany
PMI Manufacturing
Value Aug P
53.80
7:30 PM
US
Existing home sales
Million
Jul
5.57
5.55
Aug 26, 2016
6:00 PM
US
GDP Qoq (Annualised)
% Change 2Q S
1.20
1.10
2:00 PM
UK
GDP (YoY)
% Change 2Q P
2.20
Aug 30, 2016
7:30 PM
US
Consumer ConfidenceS.A./ 1985=100 Aug
97.30
97.00
Aug 31, 2016
1:25 PM Germany Unemployment change (000's)
Thousands Aug
(7.00)
Sep 01, 2016
2:00 PM
UK
PMI Manufacturing
Value Aug
48.20
6:30 AM
China
PMI Manufacturing
Value Aug
49.90
Source: Bloomberg, Angel Research
Market Outlook
August 22, 2016
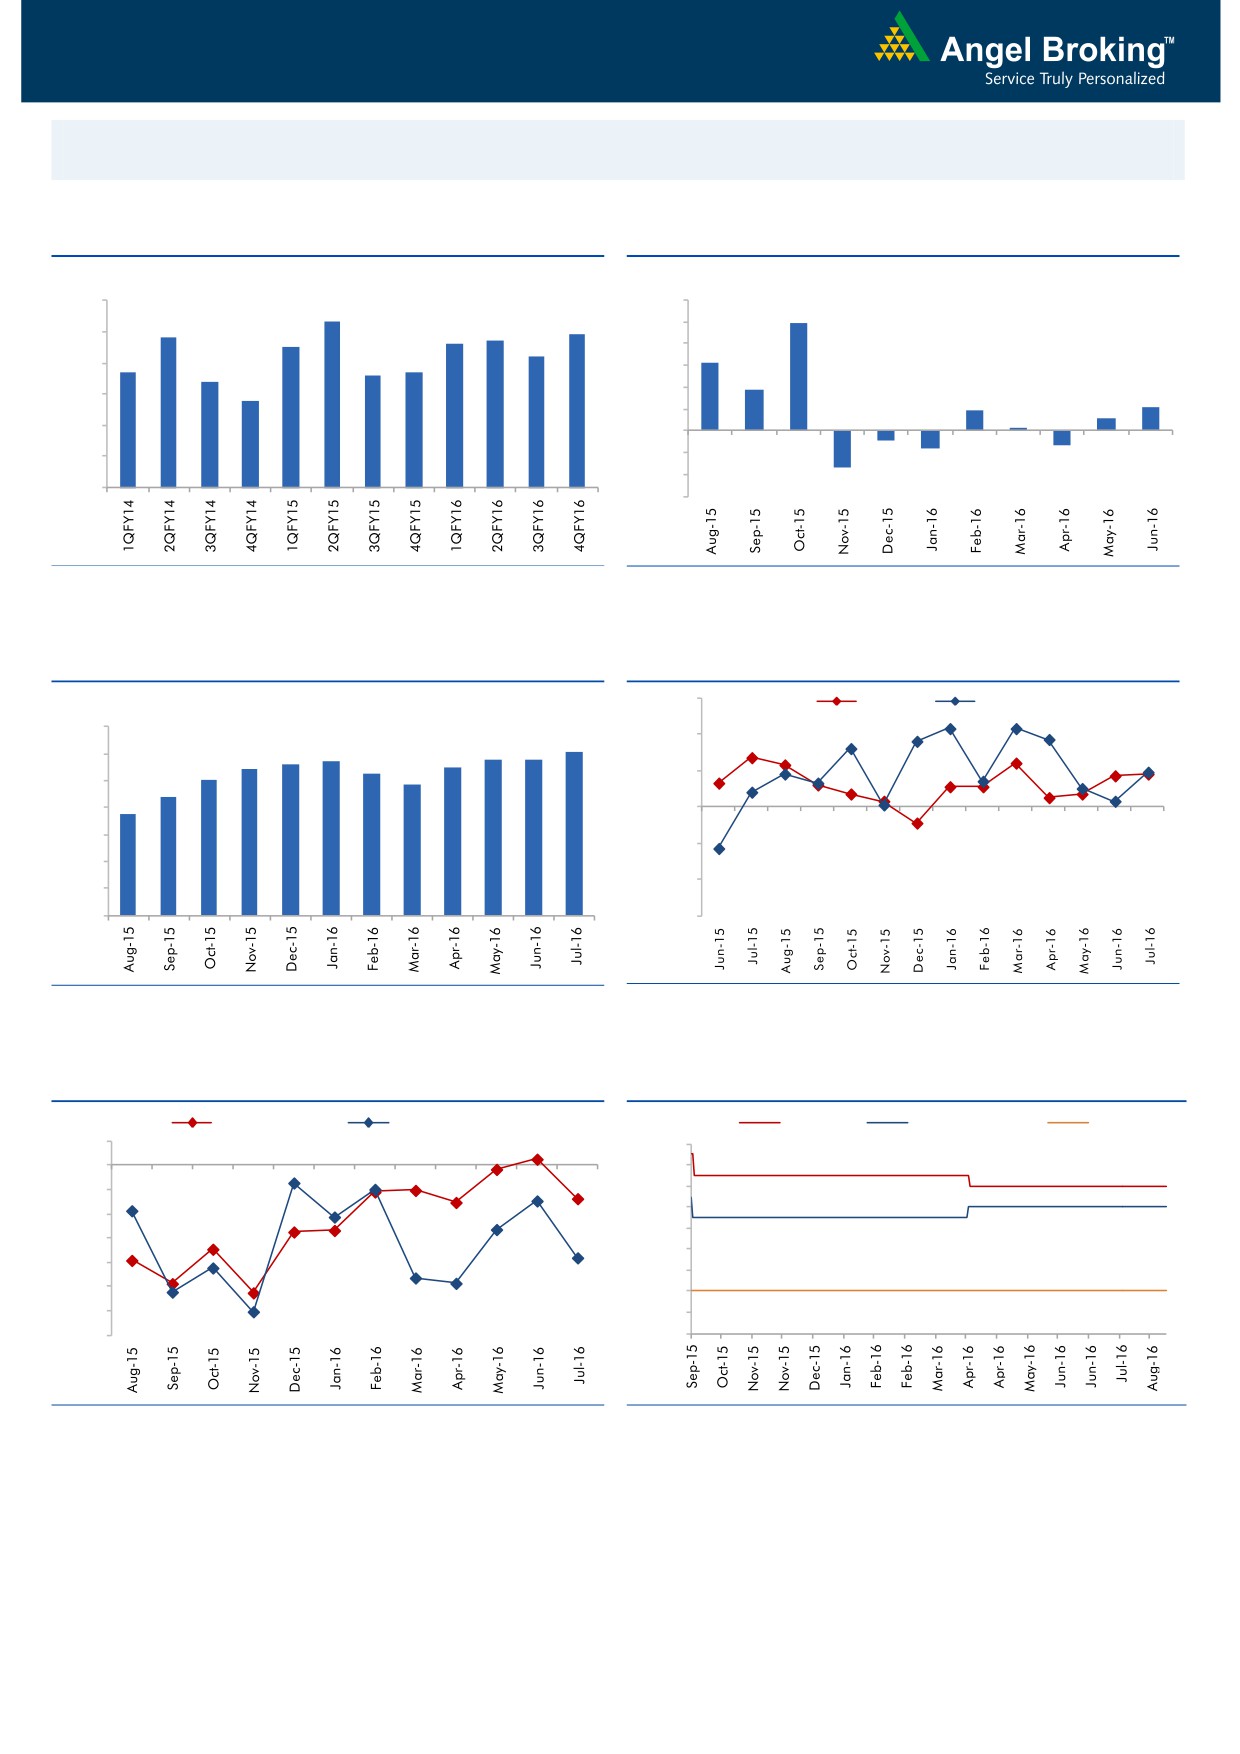
Macro watch
Exhibit 1: Quarterly GDP trends
Exhibit 2: IIP trends
(%)
(%)
9.0
8.3
12.0
9.9
7.8
7.7
7.9
10.0
8.0
7.5
7.6
7.2
8.0
6.3
6.7
6.6
6.7
7.0
6.4
6.0
3.7
5.8
4.0
2.1
6.0
1.9
1.1
2.0
0.3
5.0
-
4.0
(2.0)
(0.9)
(1.3)
(1.6)
(4.0)
3.0
(3.4)
(6.0)
Source: CSO, Angel Research
Source: MOSPI, Angel Research
Exhibit 3: Monthly CPI inflation trends
Exhibit 4: Manufacturing and services PMI
56.0
Mfg. PMI
Services PMI
(%)
7.0
6.1
54.0
5.6
5.7
5.8
5.8
5.4
5.5
6.0
5.3
5.0
4.8
52.0
5.0
4.4
3.7
4.0
50.0
3.0
48.0
2.0
46.0
1.0
-
44.0
Source: MOSPI, Angel Research
Source: Market, Angel Research; Note: Level above 50 indicates expansion
Exhibit 5: Exports and imports growth trends
Exhibit 6: Key policy rates
(%)
Exports yoy growth
Imports yoy growth
(%)
Repo rate
Reverse Repo rate
CRR
5.0
7.50
0.0
7.00
(5.0)
6.50
6.00
(10.0)
5.50
(15.0)
5.00
(20.0)
4.50
(25.0)
4.00
(30.0)
3.50
(35.0)
3.00
Source: Bloomberg, Angel Research
Source: RBI, Angel Research
Market Outlook
August 22, 2016
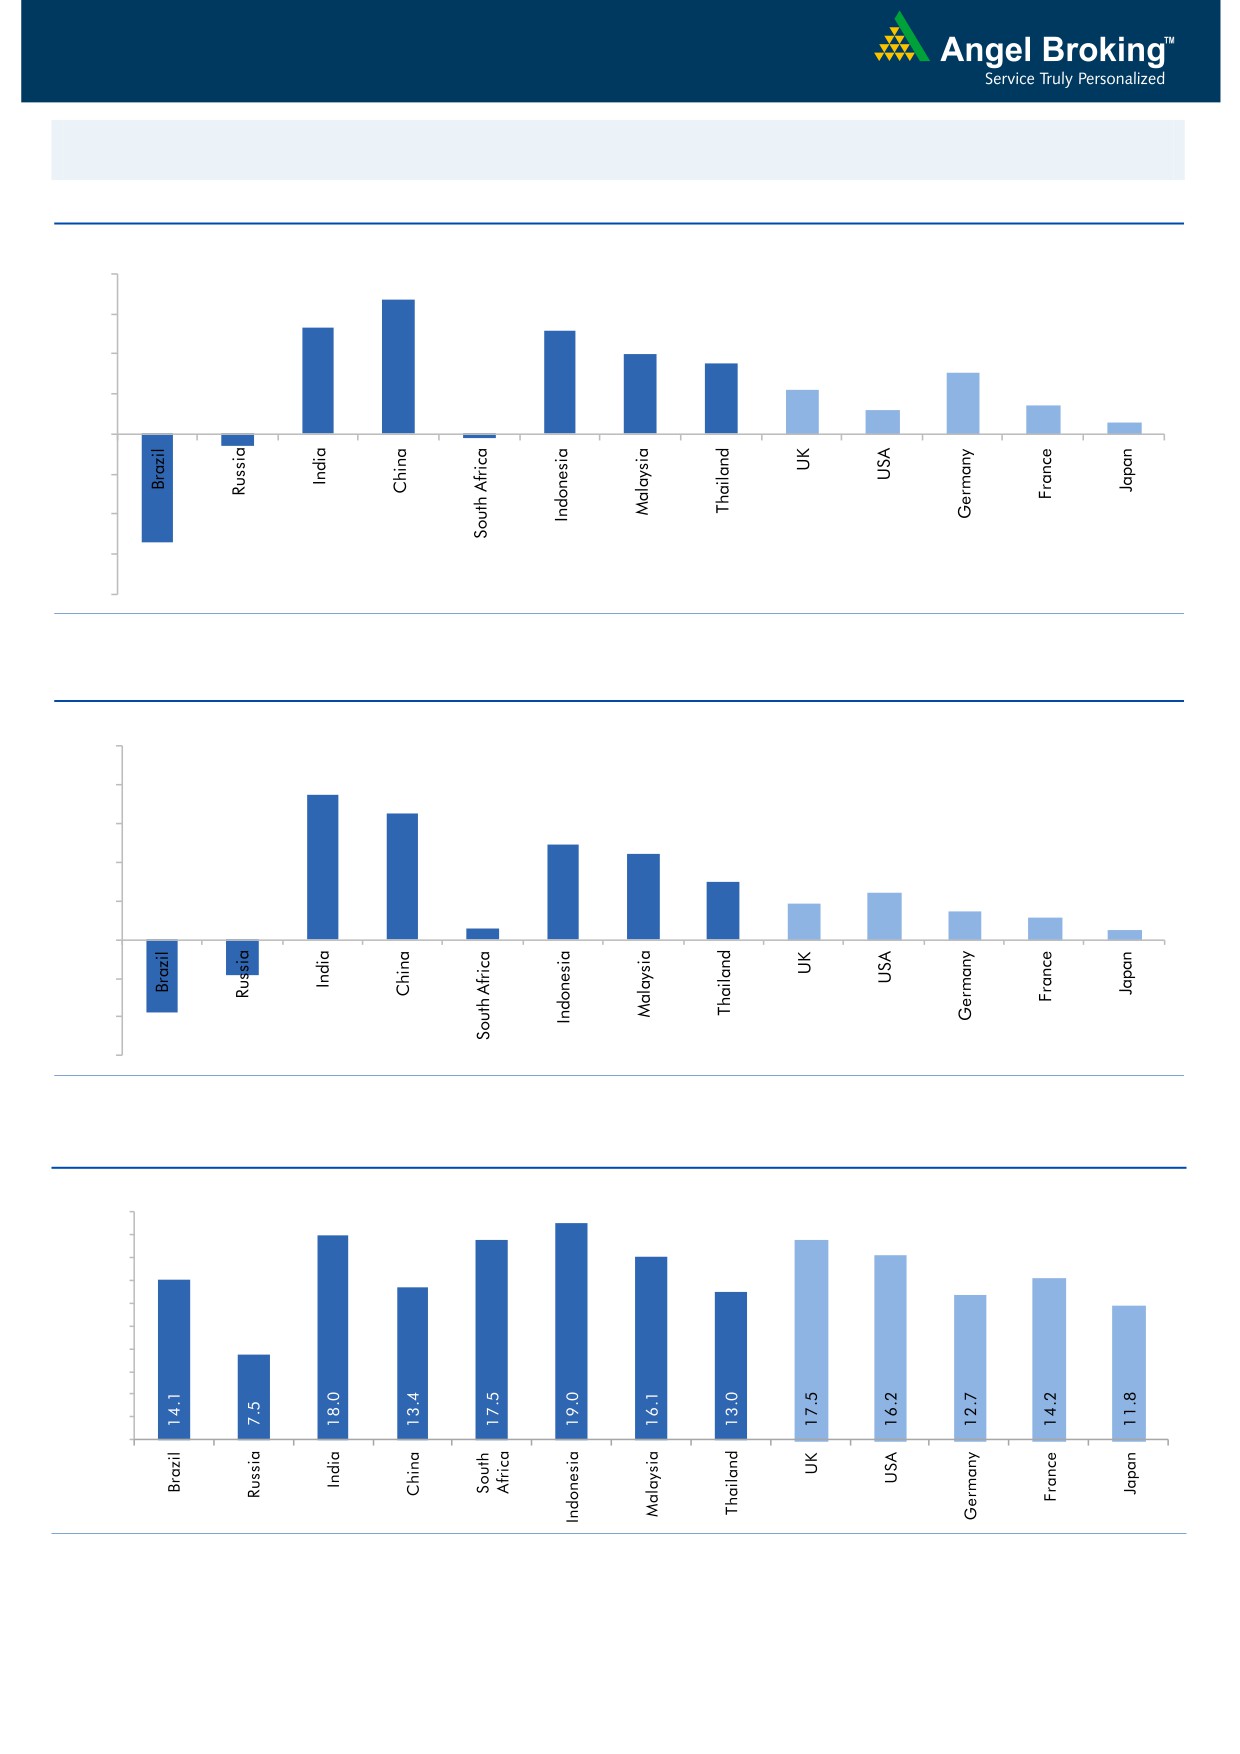
Global watch
Exhibit 1: Latest quarterly GDP Growth (%, yoy) across select developing and developed countries
(%)
8.0
6.7
6.0
5.3
5.2
4.0
3.5
4.0
3.1
2.2
2.0
1.2
1.4
0.6
-
(2.0)
(0.6)
(4.0)
(6.0)
(5.4)
(0.2)
(8.0)
Source: Bloomberg, Angel Research
Exhibit 2: 2016 GDP Growth projection by IMF (%, yoy) across select developing and developed countries
(%)
10.0
7.5
8.0
6.5
6.0
4.9
4.4
4.0
3.0
2.4
1.9
1.5
2.0
1.1
0.6
0.5
(3.8)
(1.8)
-
(2.0)
(4.0)
(6.0)
Source: IMF, Angel Research
Exhibit 3: One year forward P-E ratio across select developing and developed countries
(x)
20.0
18.0
16.0
14.0
12.0
10.0
8.0
6.0
4.0
2.0
-
Source: IMF, Angel Research
Market Outlook
August 22, 2016
Exhibit 4: Relative performance of indices across globe
Returns (%)
Country
Name of index
Closing price
1M
3M
1YR
Brazil
Bovespa
59,099
4.5
18.9
24.4
Russia
Micex
1,960
2.3
3.6
17.1
India
Nifty
8,667
1.6
11.4
3.8
China
Shanghai Composite
3,108
2.6
10.7
(20.9)
South Africa
Top 40
45,877
(1.2)
(1.6)
0.9
Mexico
Mexbol
48,297
1.7
6.8
14.5
Indonesia
LQ45
931
4.5
14.0
14.8
Malaysia
KLCI
1,688
1.1
3.2
4.8
Thailand
SET 50
981
4.1
10.4
4.9
USA
Dow Jones
18,553
(0.2)
6.4
12.7
UK
FTSE
6,859
1.9
11.4
16.3
Japan
Nikkei
16,546
(1.1)
(0.6)
(20.5)
Germany
DAX
10,544
4.0
7.1
4.1
France
CAC
4,401
0.5
1.7
(5.9)
Source: Bloomberg, Angel Research
Stock Watch
August 22, 2016
Company Name
Reco
CMP
Target
Mkt Cap
Sales ( Čcr )
OPM(%)
EPS (Č)
PER(x)
P/BV(x)
RoE(%)
EV/Sales(x)
(Č)
Price ( Č)
( Č cr )
FY17E FY18E
FY17E
FY18E
FY17E
FY18E
FY17E
FY18E
FY17E
FY18E
FY17E
FY18E
FY17E
FY18E
Agri / Agri Chemical
Rallis
Neutral
217
-
4,216
1,937
2,164
13.3
14.3
9.0
11.0
24.1
19.7
4.2
3.7
18.4
19.8
2.3
2.0
United Phosphorus
Accumulate
644
684
27,609
15,176
17,604
18.5
18.5
37.4
44.6
17.2
14.4
3.4
2.8
21.4
21.2
1.9
1.6
Auto & Auto Ancillary
Ashok Leyland
Buy
87
111
24,788
22,407
26,022
10.6
10.6
5.2
6.4
16.7
13.6
3.8
3.2
23.6
24.7
1.2
1.0
Bajaj Auto
Neutral
2,932
-
84,828
25,093
27,891
19.5
19.2
143.9
162.5
20.4
18.0
5.7
4.9
30.3
29.4
3.1
2.7
Bharat Forge
Neutral
840
-
19,547
7,726
8,713
20.5
21.2
35.3
42.7
23.8
19.7
4.4
4.0
18.9
20.1
2.6
2.3
Eicher Motors
Neutral
21,777
-
59,150
16,583
20,447
17.5
18.0
598.0
745.2
36.4
29.2
12.4
9.5
41.2
38.3
3.5
2.7
Gabriel India
Neutral
118
-
1,688
1,544
1,715
9.0
9.3
5.4
6.3
21.8
18.7
4.1
3.6
18.9
19.5
1.0
0.9
Hero Motocorp
Neutral
3,359
-
67,080
31,253
35,198
15.3
15.0
172.3
192.1
19.5
17.5
7.1
6.1
38.9
37.0
2.0
1.8
Jamna Auto Industries Neutral
226
-
1,808
1,486
1,620
9.8
9.9
15.0
17.2
15.1
13.2
3.3
2.8
21.8
21.3
1.3
1.2
L G Balakrishnan & Bros Neutral
464
-
729
1,302
1,432
11.6
11.9
43.7
53.0
10.6
8.8
1.5
1.4
13.8
14.2
0.6
0.6
Mahindra and Mahindra Neutral
1,454
-
90,298
46,534
53,077
11.6
11.7
67.3
78.1
21.6
18.6
3.5
3.1
15.4
15.8
1.9
1.7
Maruti
Neutral
4,899
-
148,001
69,186
82,217
14.7
14.4
198.5
241.4
24.7
20.3
4.8
3.9
20.2
20.0
1.8
1.5
Minda Industries
Neutral
1,156
-
1,833
2,728
3,042
9.0
9.1
68.2
86.2
16.9
13.4
3.9
3.1
23.8
24.3
0.7
0.6
Motherson Sumi
Neutral
332
-
43,915
45,896
53,687
7.8
8.3
13.0
16.1
25.5
20.6
8.2
6.5
34.7
35.4
1.0
0.9
Rane Brake Lining
Neutral
653
-
517
511
562
11.3
11.5
28.1
30.9
23.2
21.1
3.6
3.2
15.3
15.0
1.1
1.1
Setco Automotive
Neutral
46
-
614
741
837
13.0
13.0
15.2
17.0
3.0
2.7
0.5
0.5
15.8
16.3
1.2
1.1
Tata Motors
Neutral
510
-
147,247
300,209
338,549
8.9
8.4
42.7
54.3
12.0
9.4
1.9
1.6
15.6
17.2
0.6
0.5
TVS Motor
Accumulate
312
330
14,804
13,390
15,948
6.9
7.1
12.8
16.5
24.4
18.8
6.1
4.8
26.3
27.2
1.1
0.9
Amara Raja Batteries
Buy
920
1,076
15,718
5,717
6,733
18.7
18.9
38.4
48.9
24.0
18.8
6.0
4.9
25.3
24.8
2.6
2.1
Exide Industries
Neutral
178
-
15,168
7,439
8,307
15.0
15.0
8.1
9.3
22.0
19.2
3.1
2.8
14.3
16.7
1.6
1.5
Apollo Tyres
Neutral
175
-
8,923
12,877
14,504
14.3
13.9
21.4
23.0
8.2
7.6
1.3
1.1
16.4
15.2
0.9
0.8
Ceat
Buy
865
1,119
3,498
7,524
8,624
13.0
12.7
131.1
144.3
6.6
6.0
1.2
1.0
19.8
18.6
0.5
0.5
JK Tyres
Neutral
113
-
2,565
7,455
8,056
15.0
15.0
21.8
24.5
5.2
4.6
1.1
0.9
22.8
21.3
0.5
0.4
Swaraj Engines
Neutral
1,160
-
1,441
660
810
15.2
16.4
54.5
72.8
21.3
15.9
6.6
6.0
31.5
39.2
2.0
1.6
Subros
Neutral
103
-
616
1,488
1,681
11.7
11.9
6.4
7.2
16.0
14.3
1.7
1.5
10.8
11.4
0.7
0.6
Indag Rubber
Neutral
171
-
449
286
326
19.8
16.8
11.7
13.3
14.6
12.8
2.5
2.3
17.8
17.1
1.2
1.1
Capital Goods
ACE
Neutral
44
-
432
709
814
4.1
4.6
1.4
2.1
31.2
20.8
1.3
1.2
4.4
6.0
0.8
0.7
BEML
Accumulate
1,039
1,157
4,326
3,451
4,055
6.3
9.2
31.4
57.9
33.1
17.9
2.0
1.8
6.3
10.9
1.4
1.1
Bharat Electronics
Buy
1,230
1,414
29,510
8,137
9,169
16.8
17.2
58.7
62.5
21.0
19.7
3.2
2.9
44.6
46.3
2.6
2.3
Stock Watch
August 22, 2016
Company Name
Reco
CMP
Target
Mkt Cap
Sales ( Čcr )
OPM(%)
EPS (Č)
PER(x)
P/BV(x)
RoE(%)
EV/Sales(x)
(Č)
Price ( Č)
( Č cr )
FY17E
FY18E
FY17E
FY18E
FY17E
FY18E
FY17E
FY18E
FY17E
FY18E
FY17E
FY18E
FY17E
FY18E
Capital Goods
Voltas
Accumulate
382
407
12,628
6,511
7,514
7.9
8.7
12.9
16.3
29.6
23.4
5.3
4.7
16.7
18.5
1.6
1.4
BGR Energy
Neutral
115
-
829
16,567
33,848
6.0
5.6
7.8
5.9
14.7
19.5
0.8
0.8
4.7
4.2
0.2
0.1
BHEL
Neutral
142
-
34,731
28,797
34,742
-
2.8
2.3
6.9
61.7
20.6
1.1
1.0
1.3
4.8
0.8
0.6
Blue Star
Accumulate
496
527
4,726
4,351
5,024
6.4
7.1
17.2
20.6
28.9
24.0
18.8
15.7
23.1
24.1
1.1
1.0
Crompton Greaves
Neutral
87
-
5,456
5,777
6,120
5.9
7.0
3.3
4.5
26.4
19.3
1.2
1.1
4.4
5.9
0.9
0.8
Greaves Cotton
Neutral
138
-
3,370
1,755
1,881
16.8
16.9
7.8
8.5
17.7
16.2
3.5
3.3
20.6
20.9
1.6
1.5
Inox Wind
Buy
194
286
4,297
5,605
6,267
15.7
16.4
24.8
30.0
7.8
6.5
2.2
1.6
25.9
24.4
0.8
0.7
KEC International
Neutral
137
-
3,522
9,294
10,186
7.9
8.1
9.9
11.9
13.8
11.5
2.0
1.8
15.6
16.3
0.6
0.6
Thermax
Neutral
842
-
10,028
5,421
5,940
7.3
7.3
25.7
30.2
32.8
27.9
4.0
3.6
12.2
13.1
1.8
1.6
VATech Wabag
Buy
580
681
3,160
3,136
3,845
8.9
9.1
26.0
35.9
22.3
16.2
2.8
2.4
13.4
15.9
0.9
0.7
Cement
ACC
Neutral
1,689
-
31,718
11,225
13,172
13.2
16.9
44.5
75.5
38.0
22.4
3.6
3.3
11.2
14.2
2.8
2.4
Ambuja Cements
Neutral
276
-
54,863
9,350
10,979
18.2
22.5
5.8
9.5
47.6
29.1
4.0
3.6
10.2
12.5
4.5
3.9
India Cements
Neutral
132
-
4,058
4,364
4,997
18.5
19.2
7.9
11.3
16.7
11.7
1.2
1.2
8.0
8.5
1.6
1.4
JK Cement
Neutral
793
-
5,544
4,398
5,173
15.5
17.5
31.2
55.5
25.4
14.3
3.1
2.6
12.0
15.5
1.8
1.5
J K Lakshmi Cement
Neutral
440
-
5,178
2,913
3,412
14.5
19.5
7.5
22.5
58.7
19.6
3.6
3.0
12.5
18.0
2.4
2.0
Orient Cement
Neutral
168
-
3,449
2,114
2,558
18.5
20.5
8.1
11.3
20.8
14.9
3.1
2.6
9.0
14.0
2.2
1.8
UltraTech Cement
Neutral
3,915
-
107,434
25,768
30,385
21.0
23.5
111.0
160.0
35.3
24.5
4.5
3.9
13.5
15.8
4.2
3.5
Construction
ITNL
Buy
68
93
2,240
8,946
10,017
31.0
31.6
8.1
9.1
8.4
7.5
0.3
0.3
4.2
5.0
3.6
3.3
KNR Constructions
Neutral
697
-
1,961
1,210
1,595
15.4
16.0
33.9
52.1
20.6
13.4
3.2
2.7
13.6
18.0
1.7
1.2
Larsen & Toubro
Accumulate
1,490
1,700
138,906
67,665
77,249
10.7
11.5
57.3
71.2
26.0
20.9
2.4
2.2
12.6
14.3
2.2
1.9
Gujarat Pipavav Port
Neutral
174
-
8,388
705
788
52.2
51.7
5.0
5.6
34.7
31.0
3.4
3.1
11.2
11.2
11.6
9.9
MBL Infrastructures
Buy
116
285
480
2,797
3,405
14.7
15.4
21.0
34.8
5.5
3.3
0.6
0.5
11.0
16.2
0.8
0.8
Nagarjuna Const.
Neutral
85
-
4,728
8,842
9,775
9.1
8.8
5.3
6.4
16.1
13.3
1.3
1.2
8.2
9.1
0.7
0.6
PNC Infratech
Buy
118
647
3,034
2,350
2,904
13.4
13.7
48.0
42.0
2.5
2.8
0.5
0.4
16.8
13.2
1.4
1.1
Simplex Infra
Neutral
299
-
1,477
6,829
7,954
10.5
10.5
31.4
37.4
9.5
8.0
1.0
0.9
9.9
13.4
0.6
0.5
Power Mech Projects
Neutral
531
-
781
1,801
2,219
12.7
14.6
72.1
113.9
7.4
4.7
1.4
1.1
16.8
11.9
0.4
0.3
Sadbhav Engineering
Neutral
287
-
4,915
3,598
4,140
10.3
10.6
9.0
11.9
31.8
24.1
3.3
2.9
9.9
11.9
1.7
1.4
NBCC
Neutral
242
-
14,526
7,428
9,549
7.9
8.6
8.2
11.0
29.5
22.0
1.5
1.2
28.2
28.7
1.7
1.2
MEP Infra
Neutral
42
-
680
1,877
1,943
30.6
29.8
3.0
4.2
14.0
10.0
6.8
4.6
0.6
0.6
1.7
1.6
Stock Watch
August 22, 2016
Company Name
Reco
CMP
Target
Mkt Cap
Sales ( Čcr )
OPM(%)
EPS (Č)
PER(x)
P/BV(x)
RoE(%)
EV/Sales(x)
(Č)
Price ( Č)
( Č cr )
FY17E
FY18E
FY17E
FY18E
FY17E
FY18E
FY17E
FY18E
FY17E
FY18E
FY17E
FY18E
FY17E
FY18E
Construction
SIPL
Neutral
96
-
3,397
1,036
1,252
65.5
66.2
(8.4)
(5.6)
3.6
4.1
(22.8)
(15.9)
11.5
9.6
Engineers India
Neutral
236
-
7,945
1,725
1,935
16.0
19.1
11.4
13.9
20.7
17.0
2.9
2.8
13.4
15.3
3.4
3.0
Financials
Axis Bank
Neutral
588
-
140,437
58,081
66,459
3.5
3.5
32.4
44.6
18.2
13.2
2.4
2.1
13.6
16.5
-
-
Bank of Baroda
Neutral
162
-
37,247
19,980
23,178
1.8
1.8
11.5
17.3
14.1
9.3
1.6
1.3
8.3
10.1
-
-
Canara Bank
Neutral
266
-
14,457
15,225
16,836
1.8
1.8
14.5
28.0
18.4
9.5
1.3
1.0
5.8
8.5
-
-
Dewan Housing Finance Neutral
263
-
7,686
2,225
2,688
2.9
2.9
29.7
34.6
8.9
7.6
1.4
1.2
16.1
16.8
-
-
Equitas Holdings
Buy
186
235
6,230
939
1,281
11.7
11.5
5.8
8.2
32.0
22.7
2.8
2.5
10.9
11.5
-
-
Federal Bank
Neutral
66
-
11,409
9,353
10,623
2.9
2.9
4.4
5.8
15.1
11.5
1.4
1.3
9.5
11.0
-
-
HDFC
Neutral
1,370
-
216,537
11,475
13,450
3.4
3.4
45.3
52.5
30.2
26.1
5.8
5.2
20.2
20.5
-
-
HDFC Bank
Accumulate
1,245
1,350
315,189
46,097
55,433
4.5
4.5
58.4
68.0
21.3
18.3
3.7
3.1
18.8
18.6
-
-
ICICI Bank
Neutral
254
-
147,750
39,029
45,903
3.3
3.3
16.7
16.3
15.2
15.6
1.9
1.7
10.1
12.4
-
-
LIC Housing Finance
Neutral
554
-
27,933
3,712
4,293
2.6
2.5
39.0
46.0
14.2
12.0
2.7
2.3
19.9
20.1
-
-
Punjab Natl.Bank
Neutral
128
-
25,164
23,532
23,595
2.3
2.4
6.8
12.6
18.9
10.2
2.9
2.1
3.3
6.5
-
-
South Ind.Bank
Neutral
22
-
3,018
6,435
7,578
2.5
2.5
2.7
3.1
8.3
7.2
1.1
0.9
10.1
11.2
-
-
St Bk of India
Neutral
259
-
200,668
88,650
98,335
2.6
2.6
13.5
18.8
19.2
13.8
1.8
1.6
7.0
8.5
-
-
Union Bank
Neutral
136
-
9,339
13,450
14,925
2.3
2.3
25.5
34.5
5.3
3.9
0.8
0.7
7.5
10.2
-
-
Yes Bank
Neutral
1,337
-
56,273
8,978
11,281
3.3
3.4
74.0
90.0
18.1
14.9
3.4
2.9
17.0
17.2
-
-
FMCG
Asian Paints
Neutral
1,115
-
106,975
17,128
18,978
16.8
16.4
19.1
20.7
58.4
53.9
20.3
19.2
34.8
35.5
6.1
5.5
Britannia
Neutral
3,346
-
40,139
9,795
11,040
14.6
14.9
80.3
94.0
41.7
35.6
17.1
13.2
41.2
-
3.9
3.4
Colgate
Neutral
960
-
26,102
4,605
5,149
23.4
23.4
23.8
26.9
40.3
35.7
22.3
17.5
64.8
66.8
5.6
5.0
Dabur India
Neutral
300
-
52,686
8,315
9,405
19.8
20.7
8.1
9.2
37.0
32.6
10.3
8.5
31.6
31.0
6.0
5.3
GlaxoSmith Con*
Neutral
6,300
-
26,495
4,350
4,823
21.2
21.4
179.2
196.5
35.2
32.1
9.3
7.9
27.1
26.8
5.5
4.9
Godrej Consumer
Neutral
1,544
-
52,565
10,235
11,428
18.4
18.6
41.1
44.2
37.6
34.9
8.3
7.0
24.9
24.8
5.2
4.6
HUL
Neutral
912
-
197,379
35,252
38,495
17.6
17.4
20.4
21.9
44.7
41.7
36.7
32.2
82.2
77.3
5.4
4.9
ITC
Accumulate
251
283
303,038
40,059
44,439
39.0
39.2
9.1
10.1
27.6
24.9
7.5
6.6
27.2
26.5
7.1
6.4
Marico
Neutral
301
-
38,828
6,430
7,349
18.8
19.5
6.4
7.7
47.0
39.1
14.2
11.9
33.2
32.5
5.8
5.1
Nestle*
Neutral
6,723
-
64,819
10,073
11,807
20.7
21.5
124.8
154.2
53.9
43.6
22.1
19.9
34.8
36.7
6.2
5.3
Tata Global
Neutral
141
-
8,915
8,675
9,088
9.8
9.8
7.4
8.2
19.1
17.2
2.2
2.1
7.9
8.1
0.9
0.9
Procter & Gamble
Neutral
6,976
-
22,646
2,939
3,342
23.2
23.0
146.2
163.7
47.7
42.6
106.8
102.4
25.3
23.5
7.3
6.4
Hygiene
Stock Watch
August 22, 2016
Company Name
Reco
CMP
Target
Mkt Cap
Sales ( Čcr )
OPM(%)
EPS (Č)
PER(x)
P/BV(x)
RoE(%)
EV/Sales(x)
(Č)
Price ( Č)
( Č cr )
FY17E FY18E
FY17E
FY18E
FY17E
FY18E
FY17E
FY18E
FY17E
FY18E
FY17E
FY18E
FY17E
FY18E
IT
HCL Tech^
Buy
780
1,000
110,095
49,242
57,168
20.5
20.5
55.7
64.1
14.0
12.2
2.9
2.2
20.3
17.9
2.1
1.7
Infosys
Buy
1,021
1,370
234,541
69,934
79,025
27.5
27.5
64.8
72.0
15.8
14.2
3.5
3.2
22.0
22.3
2.8
2.4
TCS
Accumulate
2,604
3,004
513,090
121,684
136,286
27.3
27.3
135.0
150.1
19.3
17.4
6.4
5.9
33.2
33.9
4.0
3.6
Tech Mahindra
Buy
473
700
45,924
30,347
33,685
17.0
17.0
37.5
41.3
12.6
11.5
2.8
2.4
21.8
20.7
1.2
1.1
Wipro
Buy
521
680
128,625
51,631
55,822
21.7
17.9
35.9
36.9
14.5
14.1
3.0
2.8
19.0
18.1
2.2
2.0
Media
D B Corp
Neutral
407
-
7,474
2,297
2,590
27.4
28.2
21.0
23.4
19.4
17.4
4.5
3.9
23.7
23.1
3.0
2.6
HT Media
Neutral
79
-
1,831
2,693
2,991
12.6
12.9
7.9
9.0
10.0
8.7
0.9
0.8
7.8
8.3
0.3
0.1
Jagran Prakashan
Accumulate
184
205
6,018
2,355
2,635
28.0
28.0
9.9
10.8
18.6
17.1
3.7
3.2
21.7
21.7
2.6
2.3
Sun TV Network
Neutral
482
-
19,007
2,850
3,265
70.1
71.0
26.2
30.4
18.4
15.9
4.7
4.2
24.3
25.6
6.3
5.4
Hindustan Media
Neutral
268
-
1,969
1,016
1,138
24.3
25.2
27.3
30.1
9.8
8.9
1.9
1.7
16.2
15.8
1.3
1.1
Ventures
TV Today Network
Buy
300
363
1,788
637
743
27.5
27.5
18.4
21.4
16.3
14.0
2.8
2.4
17.4
17.2
2.4
2.0
Metals & Mining
Coal India
Neutral
334
-
211,093
84,638
94,297
21.4
22.3
24.5
27.1
13.6
12.3
5.7
5.4
42.6
46.0
2.0
1.8
Hind. Zinc
Neutral
228
-
96,422
14,252
18,465
55.9
48.3
15.8
21.5
14.4
10.6
2.4
2.1
17.0
20.7
6.8
5.2
Hindalco
Neutral
158
-
32,720
107,899
112,095
7.4
8.2
9.2
13.0
17.2
12.2
0.8
0.8
4.8
6.6
0.8
0.8
JSW Steel
Neutral
1,789
-
43,234
53,201
58,779
16.1
16.2
130.6
153.7
13.7
11.6
1.8
1.6
14.0
14.4
1.6
1.4
NMDC
Neutral
109
-
43,156
6,643
7,284
44.4
47.7
7.1
7.7
15.3
14.1
1.3
1.3
8.8
9.2
4.1
3.7
SAIL
Neutral
50
-
20,506
47,528
53,738
(0.7)
2.1
(1.9)
2.6
19.1
0.5
0.5
(1.6)
3.9
1.3
1.2
Vedanta
Neutral
179
-
53,157
71,744
81,944
19.2
21.7
13.4
20.1
13.4
8.9
1.1
1.0
8.4
11.3
1.1
0.8
Tata Steel
Neutral
392
-
38,101
121,374
121,856
7.2
8.4
18.6
34.3
21.1
11.4
1.3
1.2
6.1
10.1
0.9
0.9
Oil & Gas
Cairn India
Neutral
211
-
39,550
9,127
10,632
4.3
20.6
8.8
11.7
24.0
18.0
0.8
0.8
3.3
4.2
5.6
4.6
GAIL
Neutral
364
-
46,135
56,220
65,198
9.3
10.1
27.1
33.3
13.4
10.9
1.2
1.1
9.3
10.7
1.0
0.9
ONGC
Neutral
242
-
207,000
137,222
152,563
15.0
21.8
19.5
24.1
12.4
10.0
1.1
1.0
8.5
10.1
1.8
1.6
Petronet LNG
Neutral
344
-
25,789
-
0
-
-
-
-
-
-
Indian Oil Corp
Neutral
566
-
137,471
373,359
428,656
5.9
5.5
54.0
59.3
10.5
9.6
1.6
1.5
16.0
15.6
0.5
0.4
Reliance Industries
Neutral
1,015
-
329,060
301,963
358,039
12.1
12.6
87.7
101.7
11.6
10.0
1.2
1.1
10.7
11.3
1.6
1.3
Pharmaceuticals
Alembic Pharma
Neutral
647
-
12,192
3,483
4,083
20.2
21.4
24.3
30.4
26.6
21.3
6.1
4.8
25.5
25.3
3.4
2.8
Aurobindo Pharma
Buy
764
877
44,686
15,720
18,078
23.7
23.7
41.4
47.3
18.5
16.1
4.8
3.8
29.6
26.1
3.0
2.6
Aventis*
Neutral
4,344
-
10,003
2,357
2,692
17.3
17.3
153.5
169.2
28.3
25.7
4.8
3.9
25.8
28.4
3.9
3.2
Cadila Healthcare
Accumulate
373
400
38,134
11,126
13,148
22.0
22.0
17.1
20.0
21.8
18.6
5.6
4.5
28.8
26.6
3.4
2.8
Stock Watch
August 22, 2016
Company Name
Reco
CMP
Target
Mkt Cap
Sales ( Čcr )
OPM(%)
EPS (Č)
PER(x)
P/BV(x)
RoE(%)
EV/Sales(x)
(Č)
Price ( Č)
( Č cr )
FY17E FY18E
FY17E
FY18E
FY17E
FY18E
FY17E
FY18E
FY17E
FY18E
FY17E
FY18E
FY17E
FY18E
Pharmaceuticals
Cipla
Reduce
556
490
44,642
15,378
18,089
17.4
18.4
21.6
27.2
25.7
20.4
3.3
2.9
13.7
15.2
3.1
2.6
Dr Reddy's
Neutral
3,011
-
51,354
16,043
18,119
23.1
24.7
126.0
157.8
23.9
19.1
3.5
3.0
15.7
17.1
3.2
2.8
Dishman Pharma
Sell
169
45
2,729
1,718
1,890
22.7
22.8
9.5
11.3
17.8
15.0
1.7
1.6
10.1
10.9
2.1
1.8
GSK Pharma*
Neutral
3,118
-
26,414
3,528
3,811
16.6
18.8
51.8
59.4
60.2
52.5
16.1
16.0
26.3
30.6
7.3
6.8
Indoco Remedies
Sell
307
225
2,829
1,112
1,289
18.2
18.2
13.2
15.6
23.3
19.7
4.1
3.5
19.2
19.2
2.6
2.3
Ipca labs
Buy
514
613
6,483
3,303
3,799
15.3
15.3
17.3
19.7
29.7
26.1
2.6
2.4
9.1
9.4
2.1
1.8
Lupin
Accumulate
1,577
1,809
71,109
15,912
18,644
26.4
26.7
58.1
69.3
27.2
22.8
5.3
4.3
21.4
20.9
4.6
3.8
Sun Pharma
Buy
783
944
188,372
31,129
35,258
30.0
30.9
28.0
32.8
28.0
23.9
4.3
3.6
18.7
18.9
5.7
4.8
Power
Tata Power
Neutral
78
-
21,110
36,916
39,557
17.4
27.1
5.1
6.3
15.3
12.4
1.4
1.2
9.0
10.3
1.6
1.4
NTPC
Neutral
167
-
137,493
86,605
95,545
17.5
20.8
11.8
13.4
14.1
12.4
1.4
1.3
10.5
11.1
2.9
2.9
Power Grid
Neutral
181
-
94,639
25,763
29,762
74.3
73.1
14.8
17.3
12.2
10.5
1.9
1.7
16.9
17.5
8.0
7.6
Real Estate
MLIFE
Buy
436
554
1,789
925
1,139
18.4
22.3
18.3
33.8
23.8
12.9
1.1
1.1
4.9
8.5
2.6
2.1
Telecom
Bharti Airtel
Neutral
351
-
140,249
105,086
114,808
34.5
34.7
12.2
16.4
28.8
21.4
1.9
1.8
6.8
8.4
2.3
2.0
Idea Cellular
Neutral
94
-
33,704
40,133
43,731
37.2
37.1
6.4
6.5
14.6
14.4
1.2
1.1
8.2
7.6
1.9
1.6
zOthers
Abbott India
Neutral
4,670
-
9,923
3,153
3,583
14.1
14.4
152.2
182.7
30.7
25.6
150.6
128.7
25.6
26.1
2.9
2.5
Bajaj Electricals
Accumulate
260
277
2,626
5,099
5,805
5.7
5.9
11.4
14.6
22.9
17.8
3.1
2.7
13.4
15.1
0.5
0.4
Finolex Cables
Neutral
435
-
6,650
2,883
3,115
12.0
12.1
14.2
18.6
30.6
23.4
16.3
14.2
15.8
14.6
2.0
1.8
Goodyear India*
Buy
554
631
1,278
1,598
1,704
10.4
10.2
49.4
52.6
11.2
10.5
51.8
45.4
18.2
17.0
0.5
62.3
Hitachi
Neutral
1,458
-
3,966
2,081
2,433
8.8
8.9
33.4
39.9
43.7
36.6
35.2
29.4
22.1
21.4
1.8
1.5
Jyothy Laboratories
Neutral
284
-
5,140
1,440
2,052
11.5
13.0
8.5
10.0
33.4
28.4
8.1
7.5
18.6
19.3
3.9
2.7
MRF
Buy
36,092
45,575
15,307
-
0
-
-
-
-
-
-
Page Industries
Neutral
14,322
-
15,974
2,450
3,124
20.1
17.6
299.0
310.0
47.9
46.2
319.0
243.5
47.1
87.5
6.5
5.1
Relaxo Footwears
Neutral
465
-
5,581
2,085
2,469
9.2
8.2
7.6
8.0
61.5
58.5
23.8
20.4
17.9
18.8
2.8
2.4
Siyaram Silk Mills
Buy
1,130
1,347
1,059
1,799
2,040
11.6
11.7
104.9
122.4
10.8
9.2
1.8
1.5
16.4
16.4
0.8
0.7
Styrolution ABS India*
Neutral
575
-
1,010
1,440
1,537
9.2
9.0
40.6
42.6
14.2
13.5
36.1
32.9
12.3
11.6
0.6
0.6
TVS Srichakra
Buy
2,538
2,932
1,943
2,304
2,614
13.7
13.8
231.1
266.6
11.0
9.5
285.1
224.5
33.9
29.3
0.8
0.7
HSIL
Neutral
344
-
2,490
2,384
2,515
15.8
16.3
15.3
19.4
22.5
17.8
22.4
19.3
7.8
9.3
1.2
1.1
Kirloskar Engines India
Neutral
286
-
4,135
2,554
2,800
9.9
10.0
10.5
12.1
27.2
23.6
11.4
10.8
10.7
11.7
1.3
1.1
Ltd
M M Forgings
Neutral
423
-
511
546
608
20.4
20.7
41.3
48.7
10.3
8.7
57.9
51.3
16.6
17.0
0.8
0.7
Stock Watch
August 22, 2016
Company Name
Reco
CMP
Target
Mkt Cap
Sales ( Čcr )
OPM(%)
EPS (Č)
PER(x)
P/BV(x)
RoE(%)
EV/Sales(x)
(Č)
Price ( Č)
( Č cr )
FY17E
FY18E
FY17E
FY18E
FY17E
FY18E
FY17E
FY18E
FY17E
FY18E
FY17E
FY18E
FY17E
FY18E
zOthers
Banco Products (India) Neutral
215
-
1,536
1,353
1,471
12.3
12.4
14.5
16.3
14.8
13.2
20.5
18.4
14.5
14.6
1.1
117.4
Competent Automobiles Neutral
156
-
96
1,137
1,256
3.1
2.7
28.0
23.6
5.6
6.6
29.9
27.0
14.3
11.5
0.1
0.1
Nilkamal
Neutral
1,223
-
1,825
1,995
2,165
10.7
10.4
69.8
80.6
17.5
15.2
69.9
60.7
16.6
16.5
0.9
0.8
Visaka Industries
Neutral
160
-
254
1,051
1,138
10.3
10.4
21.0
23.1
7.6
6.9
20.5
19.2
9.0
9.2
0.5
0.5
Transport Corporation of
Neutral
351
-
2,685
2,671
2,911
8.5
8.8
13.9
15.7
25.3
22.4
3.5
3.1
13.7
13.8
1.1
1.0
India
Elecon Engineering
Accumulate
56
63
608
1,482
1,660
13.7
14.5
3.9
5.8
14.3
9.6
3.4
3.1
7.8
10.9
0.7
0.7
Surya Roshni
Buy
176
201
771
3,342
3,625
7.8
7.5
17.3
19.8
10.2
8.9
19.3
15.5
10.5
10.8
0.5
0.4
MT Educare
Neutral
133
-
529
366
417
17.7
18.2
9.4
10.8
14.2
12.3
3.1
2.7
22.2
22.3
1.3
1.1
Radico Khaitan
Buy
101
125
1,340
1,659
1,802
13.0
13.2
6.3
7.4
15.9
13.7
1.4
1.3
8.6
9.3
1.3
1.1
Garware Wall Ropes
Neutral
515
-
1,126
873
938
12.9
13.1
30.9
34.9
16.7
14.7
2.6
2.3
15.7
15.2
1.2
1.1
Wonderla Holidays
Neutral
407
-
2,297
287
355
38.0
40.0
11.3
14.2
36.0
28.6
5.2
4.5
21.4
23.9
7.6
6.1
Linc Pen & Plastics
Accumulate
261
283
386
382
420
9.3
9.5
13.5
15.7
19.4
16.6
3.3
2.9
17.1
17.3
1.1
1.0
The Byke Hospitality
Neutral
161
-
644
287
384
20.5
20.5
7.6
10.7
21.1
15.0
4.4
3.6
20.7
23.5
2.3
1.7
Interglobe Aviation
Neutral
881
-
31,737
21,122
26,005
14.5
27.6
110.7
132.1
8.0
6.7
47.6
34.0
168.5
201.1
1.5
1.2
Coffee Day Enterprises
Neutral
241
-
4,959
2,964
3,260
20.5
21.2
4.7
8.0
-
30.1
2.8
2.6
5.5
8.5
2.1
1.9
Ltd
Navneet Education
Neutral
102
-
2,436
1,062
1,147
24.0
24.0
6.1
6.6
16.8
15.4
3.5
3.1
20.6
19.8
2.3
2.2
Navkar Corporation
Buy
195
265
2,786
408
612
42.9
42.3
6.8
11.5
28.8
17.0
2.0
1.8
6.9
10.5
7.7
5.2
UFO Moviez
Neutral
493
-
1,361
619
685
33.2
33.4
30.0
34.9
16.5
14.1
2.3
2.0
13.8
13.9
2.0
1.6
VRL Logistics
Neutral
307
-
2,800
1,902
2,119
16.7
16.6
14.6
16.8
21.1
18.2
4.6
4.1
21.9
22.2
1.6
1.4
Team Lease Serv.
Neutral
1,065
-
1,820
3,229
4,001
1.5
1.8
22.8
32.8
46.8
32.4
5.0
4.3
10.7
13.4
0.5
0.4
S H Kelkar & Co.
Neutral
291
-
4,201
1,036
1,160
15.1
15.0
6.1
7.2
47.6
40.5
5.1
4.7
10.7
11.5
3.9
3.5
Quick Heal
Neutral
244
-
1,712
408
495
27.3
27.0
7.7
8.8
31.6
27.8
2.9
2.9
9.3
10.6
3.3
2.7
Narayana Hrudaya
Neutral
308
-
6,289
1,873
2,166
11.5
11.7
2.6
4.0
116.4
77.6
7.1
6.5
6.1
8.3
3.4
2.9
Manpasand Bever.
Neutral
728
-
3,643
836
1,087
19.6
19.4
16.9
23.8
43.1
30.6
5.2
4.5
12.0
14.8
4.1
3.0
Parag Milk Foods
Neutral
318
-
2,673
1,919
2,231
9.3
9.6
9.5
12.9
33.7
24.6
5.2
4.3
15.5
17.5
1.5
1.3
Source: Company, Angel Research; Note: *December year end; #September year end; &October year end; Price as on August 19, 2016
Market Outlook
August 22, 2016
Research Team Tel: 022 - 39357800
DISCLAIMER
Angel Broking Private Limited (hereinafter referred to as “Angel”) is a registered Member of National Stock Exchange of India
Limited,Bombay Stock Exchange Limited and Metropolitan Stock Exchange Limited. It is also registered as a Depository Participant with
CDSL and Portfolio Manager with SEBI. It also has registration with AMFI as a Mutual Fund Distributor. Angel Broking Private Limited is a
registered entity with SEBI for Research Analyst in terms of SEBI (Research Analyst) Regulations, 2014 vide registration number
INH000000164. Angel or its associates has not been debarred/ suspended by SEBI or any other regulatory authority for accessing
/dealing in securities Market. Angel or its associates/analyst has not received any compensation / managed or
co-managed public offering of securities of the company covered by Analyst during the past twelve months.
This document is solely for the personal information of the recipient, and must not be singularly used as the basis of any investment
decision. Nothing in this document should be construed as investment or financial advice. Each recipient of this document should make
such investigations as they deem necessary to arrive at an independent evaluation of an investment in the securities of the companies
referred to in this document (including the merits and risks involved), and should consult their own advisors to determine the merits and
risks of such an investment.
Reports based on technical and derivative analysis center on studying charts of a stock's price movement, outstanding positions and
trading volume, as opposed to focusing on a company's fundamentals and, as such, may not match with a report on a company's
fundamentals. Investors are advised to refer the Fundamental and Technical Research Reports available on our website to evaluate the
contrary view, if any.
The information in this document has been printed on the basis of publicly available information, internal data and other reliable
sources believed to be true, but we do not represent that it is accurate or complete and it should not be relied on as such, as this
document is for general guidance only. Angel Broking Pvt. Limited or any of its affiliates/ group companies shall not be in any way
responsible for any loss or damage that may arise to any person from any inadvertent error in the information contained in this report.
Angel Broking Pvt. Limited has not independently verified all the information contained within this document. Accordingly, we cannot
testify, nor make any representation or warranty, express or implied, to the accuracy, contents or data contained within this document.
While Angel Broking Pvt. Limited endeavors to update on a reasonable basis the information discussed in this material, there may be
regulatory, compliance, or other reasons that prevent us from doing so.
This document is being supplied to you solely for your information, and its contents, information or data may not be reproduced,
redistributed or passed on, directly or indirectly.
Neither Angel Broking Pvt. Limited, nor its directors, employees or affiliates shall be liable for any loss or damage that may arise from
or in connection with the use of this information.